
Graphics Metadata
One of the great power-user features of OmniGraffle is the ability to assign metadata to objects. Assigned metadata can then be retrieved and used in automating the construction and formatting of documents. Just watch the video at the bottom of this page to see this technique in action. Very powerful indeed!
This webpage describes the various metadata properties and methods that are available for your use in creating automated publishing tools.
Metadata Properties and User-Data Keys
OmniGraffle includes a robust architecture for associating graphic objects with metadata that includes object properties and user-defined pairs of data keys and values called user-data keys. (below: metadata settings for macOS (left), and iOS (right))
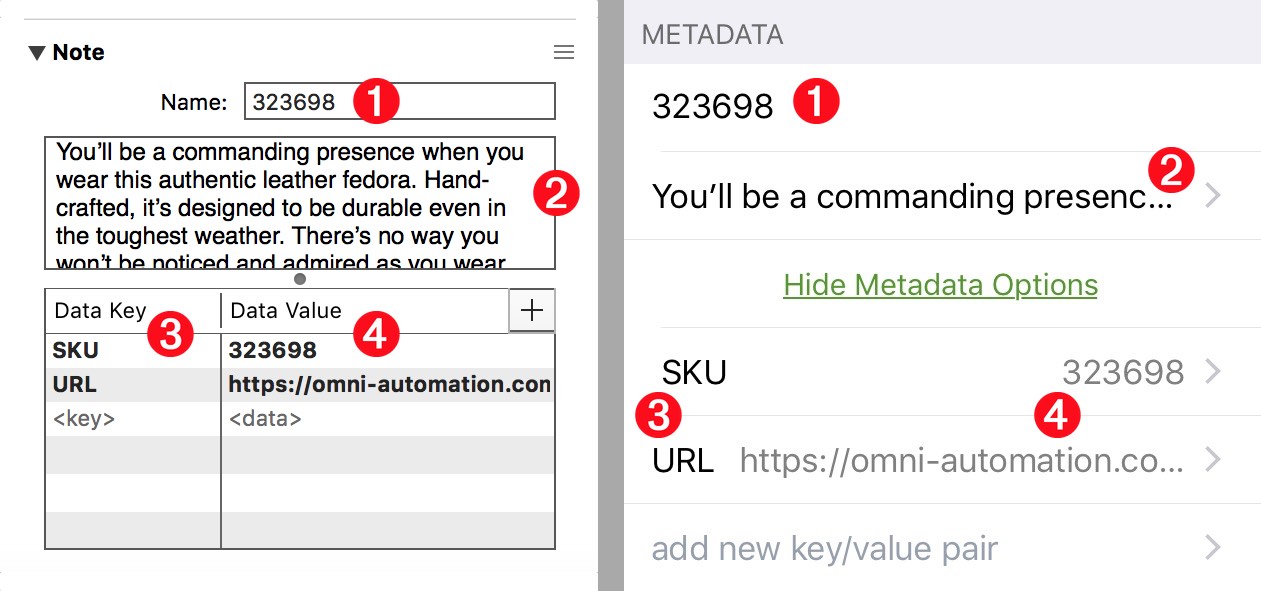
Every graphic has four basic metadata properties: id, name, notes, and userData. The id and name 1 properties can be used to identify a graphic, and the notes 2 property can store a description or other text related to the graphic.
id (Number r/o) • The unique identifier (within this document) of this graphic.
name (String or nil) • The name of this graphic, if any. The name appears (and can be edited) in the sidebar. A graphic without a name is identified in the sidebar by its type or shape (e.g. “Rectangle” or “Line”).
notes (String) • Notes attached to this graphic.
userData (Object) • An object record of keys/value pairs of user data. {"keyName":"keyValue", etc.}
User-Data Keys are one or more user-defined pairs of key names and data values that are assigned to a graphic object. A key 3 could be any type of identifier, such as a SKU or product number, or a person’s name. The key value 4 can be any type of data expressed as a string.
Graphic Metadata Methods
Here are Graphic instance methods for getting and setting user data keys and values:
userData[keyName] (String) • Although not a method, this is how to get the user data string attached to this graphic for a given key.
setUserData(keyName, valueString or nil) (String) • Set the user data string attached to this graphic for a given key.
| Get User Data Key Value for Selected Graphic | ||
| 01 | function getKeyValueForSelectedGraphic(keyName){ | |
| 02 | var graphics = document.windows[0].selection.graphics | |
| 03 | if (graphics.length == 1){ | |
| 04 | data = graphics[0].userData[keyName] | |
| 05 | if (data == null){ | |
| 06 | alert = new Alert('KEY ERROR','The key “' + keyName + '” is not assigned to the selected graphic.') | |
| 07 | alert.show(function(result){}) | |
| 08 | } else { | |
| 09 | return data | |
| 10 | } | |
| 11 | } else { | |
| 12 | alert = new Alert('SELECTION ERROR','Please select a single graphic.') | |
| 13 | alert.show(function(result){}) | |
| 14 | } | |
| 15 | } | |
| Set User Data Key and Value for Selected Graphic | ||
| 01 | function setKeyAndValueForSelectedGraphic(keyName,keyValue){ | |
| 02 | var graphics = document.windows[0].selection.graphics | |
| 03 | if (graphics.length == 1){ | |
| 04 | graphics[0].setUserData(keyName,keyValue) | |
| 05 | } else { | |
| 06 | alert = new Alert('SELECTION ERROR','Please select a single graphic.') | |
| 07 | alert.show(function(result){}) | |
| 08 | } | |
| 09 | } | |
Canvas Metadata Methods
The power of metadata is in both its usefulness as an identifier and as a container for information. Tagged-Container Publishing is a technique widely used in industries that create large amounts of content. Countless catalogs, publications, and websites that feature repeating elements rely on tagging elements with metadata to benefit from the power of automation.
After the graphics have been tagged, the next step in the automation process is to iterate a list of the identifiers and locate their associated containers in the document. The following functions are used for locating tagged graphics and for retrieving their tagged data:
graphicWithId(idNumber) (Graphic or nil) • Get the graphic with the given id, if it exists on this canvas.
graphicWithName(nameString) (Graphic or nil) • Get the first graphic with the given name, if any.
graphicWithUserDataForKey(dataString, keyName) (Graphic or nil) • Get the first graphic with the given data string for the user data key, if any.
allGraphicsWithUserDataForKey(dataString, keyName) (Array of Graphics) • Get all graphics with the given data string for the user data key.
As an example of how these functions can be used, here’s a function that locates a graphic based upon a specified user-data key and value, and then extracts the found graphic’s notes:
| Get Notes of Graphic Located by User Data | ||
| 01 | function getNotesOfGraphicWithUserDataForKey(keyValue,keyName){ | |
| 02 | cnvs = document.windows[0].selection.canvas | |
| 03 | graphic = cnvs.graphicWithUserDataForKey(keyValue, keyName) | |
| 04 | if(graphic == null){ | |
| 05 | errMsg = 'The key/value pair “' + keyName + '/' + keyValue + '” is not assigned to a graphic on the current canvas.' | |
| 06 | alert = new Alert('USER DATA ERROR',errMsg) | |
| 07 | alert.show(function(result){}) | |
| 08 | } else { | |
| 09 | return [graphic,graphic.notes] | |
| 10 | } | |
| 11 | } | |
The result of the function is an array containing an object reference to the located graphic, and its notes. You can call the function like this:
| Getting Object Reference and Notes | ||
| 01 | [grph, grphNotes] = getNotesOfGraphicWithUserDataForKey('323698','SKU') | |
Tag and Import into Containers using Web-Data
Here is an example of tagged-container publishing with OmniGraffle in action. Using OmniJS scripts embedded in a webpage, graphics in an OmniGraffle document are tagged with metadata, and then those tags are used to import images into the tagged containers based upon URLs placed in their metadata, and to create adjacent text boxes containing the notes from the graphics.
Try it Yourself!
DOWNLOAD the example OmniGraffle file, and visit the webpage shown in the video.
Functions from Example
Here are two of the OmniJS functions used in the example. The functions are embedded in the example webpage, and are triggered when their corresponding buttons are pressed.
The following script extracts the notes from the selected graphics, and creates a new text shape containing the notes placed at the user-indicated position:
| Extract Notes to Indicated Position | ||
| 01 | // default settings | |
| 02 | var defaultOffset = 12 | |
| 03 | var defaultTextSize = 14 | |
| 04 | ||
| 05 | // prompt for placement location | |
| 06 | var alert = new Alert("Notes Placement", "Should the notes be placed to the left, right, or below the selected graphic?") | |
| 07 | alert.addOption("Right") | |
| 08 | alert.addOption("Left") | |
| 09 | alert.addOption("Below") | |
| 10 | alert.show(function(result){ | |
| 11 | var cnvs = document.windows[0].selection.canvas | |
| 12 | var slds = document.windows[0].selection.solids | |
| 13 | if (result == 0){ | |
| 14 | slds.forEach(function(sld){ | |
| 15 | sName = sld.name | |
| 16 | sNotes = sld.notes | |
| 17 | cRect = sld.geometry | |
| 18 | nRect = new Rect(cRect.maxX + defaultOffset, cRect.minY, cRect.width, cRect.height) | |
| 19 | aShape = cnvs.addShape('Rectangle',nRect) | |
| 20 | aShape.text = sNotes | |
| 21 | aShape.name = sName | |
| 22 | aShape.shadowColor = null | |
| 23 | aShape.strokeType = null | |
| 24 | aShape.fillType = null | |
| 25 | aShape.autosizing = TextAutosizing.Overflow | |
| 26 | aShape.textHorizontalAlignment = HorizontalTextAlignment.Left | |
| 27 | aShape.textHorizontalPadding = 0 | |
| 28 | aShape.textVerticalPlacement = VerticalTextPlacement.Center | |
| 29 | aShape.textVerticalPadding = 0 | |
| 30 | aShape.textSize = defaultTextSize | |
| 31 | }) | |
| 32 | } else if (result == 1){ | |
| 33 | slds.forEach(function(sld){ | |
| 34 | sName = sld.name | |
| 35 | sNotes = sld.notes | |
| 36 | cRect = sld.geometry | |
| 37 | nRect = new Rect(cRect.minX - defaultOffset - cRect.width, cRect.minY, cRect.width, cRect.height) | |
| 38 | aShape = cnvs.addShape('Rectangle',nRect) | |
| 39 | aShape.text = sNotes | |
| 40 | aShape.name = sName | |
| 41 | aShape.shadowColor = null | |
| 42 | aShape.strokeType = null | |
| 43 | aShape.fillType = null | |
| 44 | aShape.autosizing = TextAutosizing.Overflow | |
| 45 | aShape.textHorizontalAlignment = HorizontalTextAlignment.Left | |
| 46 | aShape.textHorizontalPadding = 0 | |
| 47 | aShape.textVerticalPlacement = VerticalTextPlacement.Center | |
| 48 | aShape.textVerticalPadding = 0 | |
| 49 | aShape.textSize = defaultTextSize | |
| 50 | }) | |
| 51 | } else { | |
| 52 | slds.forEach(function(sld){ | |
| 53 | sName = sld.name | |
| 54 | sNotes = sld.notes | |
| 55 | cRect = sld.geometry | |
| 56 | nRect = new Rect(cRect.minX, cRect.maxY + defaultOffset, cRect.width, cRect.height) | |
| 57 | aShape = cnvs.addShape('Rectangle',nRect) | |
| 58 | aShape.text = sNotes | |
| 59 | aShape.name = sName | |
| 60 | aShape.shadowColor = null | |
| 61 | aShape.strokeType = null | |
| 62 | aShape.fillType = null | |
| 63 | aShape.autosizing = TextAutosizing.Overflow | |
| 64 | aShape.textHorizontalAlignment = HorizontalTextAlignment.Left | |
| 65 | aShape.textHorizontalPadding = 0 | |
| 66 | aShape.textVerticalPlacement = VerticalTextPlacement.Center | |
| 67 | aShape.textVerticalPadding = 0 | |
| 68 | aShape.textSize = defaultTextSize | |
| 69 | }) | |
| 70 | } | |
| 71 | }) | |
The following script scans all graphics on the current canvas for those having a specific user-data tag (“SKU”), and then extract the value of the graphic’s user-data tag (“URL”), and use its value to download and import the image referenced by the URL, into the graphic.
| Import Images based upon User-Data Tags | ||
| 01 | var cnvs = document.windows[0].selection.canvas | |
| 02 | var dataKey = 'SKU' | |
| 03 | var urlKey = 'URL' | |
| 04 | var keyValues = new Array() | |
| 05 | var urlValues = new Array() | |
| 06 | for(i = 0; i < cnvs.graphics.length; i++){ | |
| 07 | aGraph = cnvs.graphics[i] | |
| 08 | aValue = aGraph.userData[dataKey] | |
| 09 | if(aValue != null){ | |
| 10 | keyValues.push(aValue) | |
| 11 | u = aGraph.userData[urlKey] | |
| 12 | if(u != null){ | |
| 13 | urlValues.push(u) | |
| 14 | } else { | |
| 15 | urlValues.push('') | |
| 16 | } | |
| 17 | } | |
| 18 | } | |
| 19 | var valCount = keyValues.length | |
| 20 | for (i = 0; i < valCount; i++) { | |
| 21 | var keyValue = keyValues[i] | |
| 22 | aStr = urlValues[i] | |
| 23 | fileURL = URL.fromString(aStr) | |
| 24 | fileURL.fetch((function(keyValue, data) { | |
| 25 | aGraph = cnvs.graphicWithUserDataForKey(keyValue, dataKey) | |
| 26 | aGraph.image = addImage(data) | |
| 27 | }).bind(this, keyValue)) | |
| 28 | } | |
Other Examples
Here are two more examples of how a graphic’s metadata can be used to alter the parent graphic.
In the first example, the contents of the metadata pair “Fill Color” is a text string representing an array of RGB color values: "[1,0,0,1]"
The script retrieves this string from the metadata of the selected graphics, converts it into numeric values, and sets the fill color to he generated Color value:
| Set Fill Color using Metadata Tag Value | ||
| 01 | metaTag = 'Fill Color' | |
| 02 | shapes = document.windows[0].selection.solids | |
| 03 | shapes.forEach(function(shape){ | |
| 04 | tagValue = shape.userData[metaTag] | |
| 05 | colorValue = JSON.parse(tagValue) | |
| 06 | newColor = Color.RGB(colorValue[0], colorValue[1], colorValue[2], 1) | |
| 07 | shape.fillColor = newColor | |
| 08 | }) | |
The second example script checks the value of a specific metadata pair and based upon the value (which is converted from a string into an integer), performs an action, like setting fill color:
| Metadata Comparison | ||
| 01 | ||
| 02 | metaTag = 'Fill Color' | |
| 03 | shapes = document.windows[0].selection.solids | |
| 04 | shapes.forEach(function(shape){ | |
| 05 | tagValue = parseInt(shape.userData[metaTag]) | |
| 06 | if (tagValue === 1){ | |
| 07 | newFillColor = Color.red | |
| 08 | } else if (tagValue === 2){ | |
| 09 | newFillColor = Color.green | |
| 10 | } else { | |
| 11 | newFillColor = Color.blue | |
| 12 | } | |
| 13 | shape.fillColor = newFillColor | |
| 14 | }) | |
This webpage is in the process of being developed. Any content may change and may not be accurate or complete at this time.
DISCLAIMER