
The “Heat Map” Scenario
Have you ever looked at a table of data and wondered if there was a better way to represent the data, so as to better judge the impact of the information?
The technique of “Heat Mapping” is a common mechanism for visualizing data. According to Wikipedia:
A “heat map” (or heatmap) is a graphical representation of data where the individual values contained in a matrix are represented as colors [or shades of a color]. The term ‘heat map’ was originally coined and trademarked by software designer Cormac Kinney in 1991, to describe a 2D display depicting financial market information, though similar plots such as shading matrices have existed for over a century.
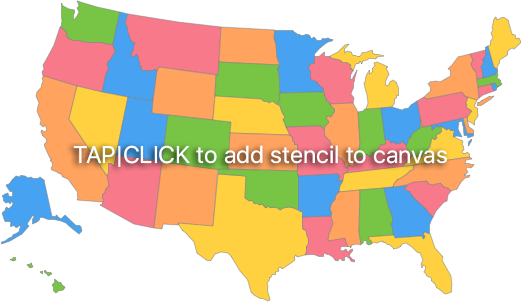
For example, this webpage contains a map of the United States and two tables of data (displayed vertically in the right page column). Clicking or tapping the map image on this page adds a map of the United States to the current OmniGraffle canvas, and clicking or tapping each table will transfer data from the table to the map on the current canvas.
This kind of interactivity enables a workflow that really shows off OmniGraffle‘s ability to visualize data! And best of all, the techniques demonstrated on this webpage work on both macOS and iOS. Here’s the workflow using OmniGraffle for macOS:
*Example webpage shown in the video above
Adding Stencil Content to the Current Canvas
In this example, each of the states in a map of the U.S. are colorized with a shade indicating the percentage that Federal tax revenue comprises of each state’s budget. To visualize the data from the provided tables, two instances of the USA map will be added to the document, each on its own canvas.
To add an instance of the map to the current canvas, the user taps or clicks the map image on the webpage. This simple user-action triggers the running of an Omni Automation script embedded in the webpage that automatically imports the contents of the previously installed USA Map stencil to the current document canvas.
The Omni Automation script shown below, performs the task of checking for the stencil and then duplicating all of the stencil items (states) to the current canvas in OmniGraffle.
| Adding Stencil Content to the Current Canvas | ||
| 01 | function importAllGraphicsFromNamedStencil(stencilName,stencilURL){ | |
| 02 | if (stencilURL === null){stencilURL = 'https://stenciltown.omnigroup.com'} | |
| 03 | var installed = false | |
| 04 | for(i = 0; i < app.stencils.length; i++) { | |
| 05 | var stencil = app.stencils[i]; | |
| 06 | if (stencil.name.localeCompare(stencilName) === 0) { | |
| 07 | cnvs = document.windows[0].selection.canvas | |
| 08 | stencil.load(function(s) { | |
| 09 | console.log("Loaded stencil: “" + s.name + "”") | |
| 10 | cnvs.duplicate(s.graphics) | |
| 11 | }) | |
| 12 | installed = true | |
| 13 | break | |
| 14 | } | |
| 15 | } | |
| 16 | if (installed === false){ | |
| 17 | var alert = new Alert("MISSING STENCIL", "The stencil “" + stencilName + "” is not installed.\n\nDo you want to download it from StencilTown?") | |
| 18 | alert.addOption("Download") | |
| 19 | alert.addOption("Cancel") | |
| 20 | alert.show(function(result){ | |
| 21 | if (result === 0){ | |
| 22 | targetURL = URL.fromString(stencilURL) | |
| 23 | targetURL.call(function(result){}) | |
| 24 | } | |
| 25 | }) | |
| 26 | } | |
| 27 | } | |
| 28 | stencilURL = 'https://stenciltown.omnigroup.com/stencils/usa-map/' | |
| 29 | importAllGraphicsFromNamedStencil('USA Map', stencilURL) | |
01-27 This function imports all graphics from the stencil whose name is passed to the handler.
02 If the passed-in value for the stencil download URL is null, then set it to the URL for the StencilTown website.
04-15 Check each of the installed stencils to see if it is the one whose name was passed-into the handler.
08-11 If the stencil name is a match, use the load() method to open the stencil file and duplicate its graphics to the current canvas.
16-26 If the passed stencil name was not matched any of the installed stencils, alert the user and give them the option to visit the StencilTown website.
27 The URL string for the USA Map stencil on the StencilTown website.
28 Call the function and pass-in the name of the stencil and its corresponding download URL.
To make the script executable from the webpage, it is encoded into an Omni Automation URL that is used as the target (href) of an HMTL link encasing the image object in the webpage’s HTML code. The script is then triggered when the user taps or clicks the image.
| Omni Automation URL Image Link | ||
| 01 | <a href="omnigraffle:///omnijs-run?script=function%20importAll-etc…"> | |
| 02 | <img src="gfx/usa-map-click.png"> | |
| 03 | </a> | |
It’s an effortless way to add a specific map to a document, triggered from a webpage. Try it yourself by tapping or clicking the USA Map image above.
Table Data Export and Heat Mapping
Once an instance of the USA Map stencil has been placed on the current cavas in OmniGraffle by the embedded automation, the next challenge is to colorize the map using the data from either of the data tables on this page.
This involves a multi-step process of:
- Extracting the data from the user chosen table
- Inserting the data into a Omni Automation script that targets the stencil on the current canvas
- Executing the Omni Automation script that matches the data objects to their corresponding graphic elements, and applies a fill color shade to each graphic based-upon the data value of the object in the source table.
To enable their data to be “extracted” by webpage JavaScripts, each of the data tables is assign a unique identifier and its elements (rows and column cells) are assigned keys and values that make them and their components accessible to script queries.
NOTE: the name of each table row is a U.S. postal code that corresponds to the tag assigned to one of the stencil graphics. These postal codes act as unique identifiers that enable the formatting scripts to match data to objects in OmniGraffle.
| Example Data Table | ||
| 01 | <table class="data-table"> | |
| 02 | <tBody id="fedAidPerStateRev2000"> | |
| 03 | <tr name="AL"> | |
| 04 | <td name="state" class="state">Alabama</td> | |
| 05 | <td name="data" class="data">33.6</td> | |
| 06 | </tr> | |
| 07 | </tBody> | |
| 08 | </table> | |
Here is the main JavaScript function embedded in the webpage that performs the series of steps listed before. It is trigger when the user taps or clicks the OmniGraffle icon at the top right of either table.
| Main Transfer Function (webpage) | ||
| 01 | function extractAndMapData(tableID){ | |
| 02 | tableData = getTableData(tableID); | |
| 03 | scriptDiv = document.getElementById(tableID + 'Code'); | |
| 04 | scriptCode = scriptDiv.innerHTML; | |
| 05 | text = encodeURIComponent(tableData); | |
| 06 | scriptCode = scriptCode.replace("XXXXX",tableData); | |
| 07 | var targetURL = "omnigraffle://localhost/omnijs-run?script=" + scriptCode; | |
| 08 | window.location = targetURL; | |
| 09 | } | |
01-09 This embedded JavaScript function extracts table data, inserts the data into the encoded Omni Automation mapping script, and executes the encoded script URL. The function takes the id of the source table as a direct parameter.
02 Passes the tableID to the getTableData() function to retrieve the data from the source table as a JSON string.
03 References the hidden DIV that holds the encoded Omni Automation script code. The ID of the DIV is the ID of its corresponding table with the word “Code” appended to it.
04 Extracts the Omni Automation script code from the DIV.
05 Percent-encodes the JSON string containing the extracted table data.
06 Replaces the placeholder “XXXXX” in the Omni Automation script with the encoded JSON data.
07 Generates an Omni Automation script URL by concatenating the URL opening with the edited script code.
08 Executes the Omni Automation script URL.
Next, let’s examine how the data is extracted from the tables.
Extract Table Data Function
The JavaScript code used to extract table data is the standard JavaScript implementation used with HTML web pages. There are no 3rd-party libraries or frameworks used.
The JavaScript function is passed the ID of the target table, which it then uses to iterate the table rows and extract the data and add it to standard JSON objects.
| Extract Table Data Function | ||
| 01 | function getTableData(tableID){ | |
| 02 | var table = document.getElementById(tableID); | |
| 03 | tableData = new Array(); | |
| 04 | for (var r = 0, n = table.rows.length; r < n; r++) { | |
| 05 | rowData = new Object(); | |
| 06 | rowName = table.rows[r].getAttribute('name'); | |
| 07 | if (rowName != ""){ | |
| 08 | rowData.id = rowName; | |
| 09 | for (var c = 0, m = table.rows[r].cells.length; c < m; c++) { | |
| 10 | cellName = table.rows[r].cells[c].getAttribute('name'); | |
| 11 | cellData = table.rows[r].cells[c].innerHTML; | |
| 12 | rowData[cellName] = cellData; | |
| 13 | } | |
| 14 | tableData.push(rowData); | |
| 15 | } | |
| 16 | } | |
| 17 | return JSON.stringify(tableData); | |
| 18 | } | |
The result of the function is a JSON array of objects containing the data for every row in the targeted table.
| Table Data as JSON | ||
| 01 | [{"id":"AL","state":"Alabama","data":"33.6"}, {"id":"AK","state":"Alaska","data":"16.3"}, {"id":"AZ","state":"Arizona","data":"26.9"}, {"id":"AR","state":"Arkansas","data":"29.7"}, {"id":"CA","state":"California","data":"24.8"}, {"id":"CO","state":"Colorado","data":"25.4"}, {"id":"CT","state":"Connecticut","data":"20.9"}, {"id":"DE","state":"Delware","data":"18.2"}, {"id":"FL","state":"Florida","data":"23.8"}, {"id":"GA","state":"Georgia","data":"27.4"}, {"id":"HI","state":"Hawaii","data":"19.6"}, {"id":"ID","state":"Idaho","data":"25.5"}, {"id":"IL","state":"Illinois","data":"23.9"}, {"id":"IN","state":"Indiana","data":"25.4"}, {"id":"IA","state":"Iowa","data":"26.6"}, {"id":"KS","state":"Kansas","data":"27.6"}, {"id":"KY","state":"Kentucky","data":"29.5"}, {"id":"LA","state":"Louisiana","data":"31.8"}, {"id":"ME","state":"Maine","data":"29.3"}, {"id":"MD","state":"Maryland","data":"22.4"}, {"id":"MA","state":"Massachusetts","data":"19.8"}, {"id":"MI","state":"Michigan","data":"23.2"}, {"id":"MN","state":"Minnesota","data":"20.9"}, {"id":"MS","state":"Mississippi","data":"34.8"}, {"id":"MO","state":"Missouri","data":"31.6"}, {"id":"MT","state":"Montana","data":"33.9"}, {"id":"NE","state":"Nebraska","data":"27.0"}, {"id":"NV","state":"Nevada","data":"18.2"}, {"id":"NH","state":"New Hampshire","data":"25.7"}, {"id":"NJ","state":"New Jersey","data":"22.7"}, {"id":"NM","state":"New Mexico","data":"27.0"}, {"id":"NY","state":"New York","data":"30.9"}, {"id":"NC","state":"North Carolina","data":"29.0"}, {"id":"ND","state":"North Dakota","data":"34.8"}, {"id":"OH","state":"Ohio","data":"27.2"}, {"id":"OK","state":"Oklahoma","data":"27.5"}, {"id":"OR","state":"Oregon","data":"32.8"}, {"id":"PA","state":"Pennsylvania","data":"25.2"}, {"id":"RI","state":"Rhode Island","data":"26.6"}, {"id":"SC","state":"South Carolina","data":"30.4"}, {"id":"SD","state":"South Dakota","data":"34.2"}, {"id":"TN","state":"Tennessee","data":"37.5"}, {"id":"TX","state":"Texas","data":"29.9"}, {"id":"UT","state":"Utah","data":"24.4"}, {"id":"VT","state":"Vermont","data":"29.8"}, {"id":"VA","state":"Virginia","data":"19.0"}, {"id":"WA","state":"Washington","data":"24.0"}, {"id":"WV","state":"West Virginia","data":"33.6"}, {"id":"WI","state":"Wisconsin","data":"21.9"}, {"id":"WY","state":"Wyoming","data":"35.8"}] | |
To enable the JSON data to be inserted into the Omni Automation script that performs the action with the OmniGraffle document, the last statement in the extraction function converts the JSON array of objects into a JSON string using the JSON.stringify() method.
Transfer Data (Mapping)
Here is the Omni Automation script that performs the task of matching data with graphics in the OmniGraffle document. In order to be available for execution by the main JavaScript webpage function, it is encoded and placed within a hidden DIV on the webpage. Here is the script unencoded:
| Transfer Data to Graphics (Heat Map) | ||
| 01 | blob = 'XXXXX' | |
| 02 | jblob = JSON.parse(blob) | |
| 03 | jblob.forEach(function(item){ | |
| 04 | aValue = Number(item.data) | |
| 05 | if (aValue < 20){ | |
| 06 | aColorValue = Color.RGB(0,1,0,1) | |
| 07 | } else if (aValue < 23){ | |
| 08 | aColorValue = Color.RGB(0,0.9,0,1) | |
| 09 | } else if (aValue < 26){ | |
| 10 | aColorValue = Color.RGB(0,0.8,0,1) | |
| 11 | } else if (aValue < 29){ | |
| 12 | aColorValue = Color.RGB(0,0.7,0,1) | |
| 13 | } else if (aValue < 31){ | |
| 14 | aColorValue = Color.RGB(0,0.6,0,1) | |
| 15 | } else if (aValue < 34){ | |
| 16 | aColorValue = Color.RGB(0,0.5,0,1) | |
| 17 | } else if (aValue < 37){ | |
| 18 | aColorValue = Color.RGB(0,0.4,0,1) | |
| 19 | } else if (aValue < 40){ | |
| 20 | aColorValue = Color.RGB(0,0.3,0,1) | |
| 21 | } else { | |
| 22 | aColorValue = Color.RGB(0,0.2,0,1) | |
| 23 | } | |
| 24 | aGraphic = document.windows[0].selection.canvas.graphicWithName(item.id) | |
| 25 | aGraphic.fillColor = aColorValue | |
| 26 | aGraphic.notes = item.state + ': ' + item.data | |
| 27 | }) | |
01 When this function is called by the main extractAndMapData() function, the placeholder XXXXX is replaced with the encoded JSON data string.
02 The JSON string is converted into a JSON object array using the parse() method.
03-27 Process each object in the JSON object array using the forEach() method.
04 Get the object’s data value as a number.
05-23 Create a color value based upon the data value.
24 Use the graphicWithName() method to identify the target graphic by passing it the value of the object’s id property. This value will match one of the names of the state graphics, which in this case, is the postal abbreviation for a state, like MA for Massachusetts.
25 Assign the color value to the graphic’s fillColor property.
26 Set the value of the graphic’s notes property to the value of the object’s state and data properties.
To be available for use, the script is encoded and placed within a hidden DIV whose ID matches the ID of its corresponding source table.
| Encoded Script Placed in Hidden DIV | ||
| 01 | <div id="fedAidPerState2000Code" class="script-code">blob%20-etc.</div> | |
Works on iPad Pro Too!
And the best part is that Omni Automation is dual platform: macOS and iOS. See for yourself!

| Alabama | 33.6 |
| Alaska | 16.3 |
| Arizona | 26.9 |
| Arkansas | 29.7 |
| California | 24.8 |
| Colorado | 25.4 |
| Connecticut | 20.9 |
| Delware | 18.2 |
| Florida | 23.8 |
| Georgia | 27.4 |
| Hawaii | 19.6 |
| Idaho | 25.5 |
| Illinois | 23.9 |
| Indiana | 25.4 |
| Iowa | 26.6 |
| Kansas | 27.6 |
| Kentucky | 29.5 |
| Louisiana | 31.8 |
| Maine | 29.3 |
| Maryland | 22.4 |
| Massachusetts | 19.8 |
| Michigan | 23.2 |
| Minnesota | 20.9 |
| Mississippi | 34.8 |
| Missouri | 31.6 |
| Montana | 33.9 |
| Nebraska | 27.0 |
| Nevada | 18.2 |
| New Hampshire | 25.7 |
| New Jersey | 22.7 |
| New Mexico | 27.0 |
| New York | 30.9 |
| North Carolina | 29.0 |
| North Dakota | 34.8 |
| Ohio | 27.2 |
| Oklahoma | 27.5 |
| Oregon | 32.8 |
| Pennsylvania | 25.2 |
| Rhode Island | 26.6 |
| South Carolina | 30.4 |
| South Dakota | 34.2 |
| Tennessee | 37.5 |
| Texas | 29.9 |
| Utah | 24.4 |
| Vermont | 29.8 |
| Virginia | 19.0 |
| Washington | 24.0 |
| West Virginia | 33.6 |
| Wisconsin | 21.9 |
| Wyoming | 35.8 |
| Alabama | 34.9 |
| Alaska | 26.9 |
| Arizona | 35.9 |
| Arkansas | 33.5 |
| California | 26.0 |
| Colorado | 29.1 |
| Connecticut | 24.6 |
| Delware | 26.7 |
| Florida | 33.2 |
| Georgia | 36.7 |
| Hawaii | 24.8 |
| Idaho | 33.8 |
| Illinois | 26.8 |
| Indiana | 33.0 |
| Iowa | 32.6 |
| Kansas | 25.5 |
| Kentucky | 38.5 |
| Louisiana | 40.1 |
| Maine | 36.6 |
| Maryland | 29.4 |
| Massachusetts | 27.8 |
| Michigan | 32.3 |
| Minnesota | 25.5 |
| Mississippi | 40.9 |
| Missouri | 38.0 |
| Montana | 39.1 |
| Nebraska | 31.0 |
| Nevada | 24.8 |
| New Hampshire | 28.1 |
| New Jersey | 27.3 |
| New Mexico | 34.5 |
| New York | 32.8 |
| North Carolina | 32.7 |
| North Dakota | 16.8 |
| Ohio | 35.0 |
| Oklahoma | 34.0 |
| Oregon | 36.0 |
| Pennsylvania | 30.8 |
| Rhode Island | 34.7 |
| South Carolina | 30.7 |
| South Dakota | 37.2 |
| Tennessee | 39.9 |
| Texas | 31.8 |
| Utah | 28.1 |
| Vermont | 33.6 |
| Virginia | 22.8 |
| Washington | 29.2 |
| West Virginia | 34.8 |
| Wisconsin | 27.8 |
| Wyoming | 35.5 |