Building an Org-Chart
The work of creating an organization chart dynamically is performed by a series of Omni Automation actions grouped together into a plugin you install into the Automation menu in OmniGraffle.
These scripts do the complex work of looking up the reports for the person represented by the selected graphic, and creating linked-clones of the selected graphic, each with the metadata of one of the manager’s reporting employees.
Very powerful, and fun to use!
| DO THIS ► | DOWNLOAD the Org-Chart Connector OmniGraffle plugin. |
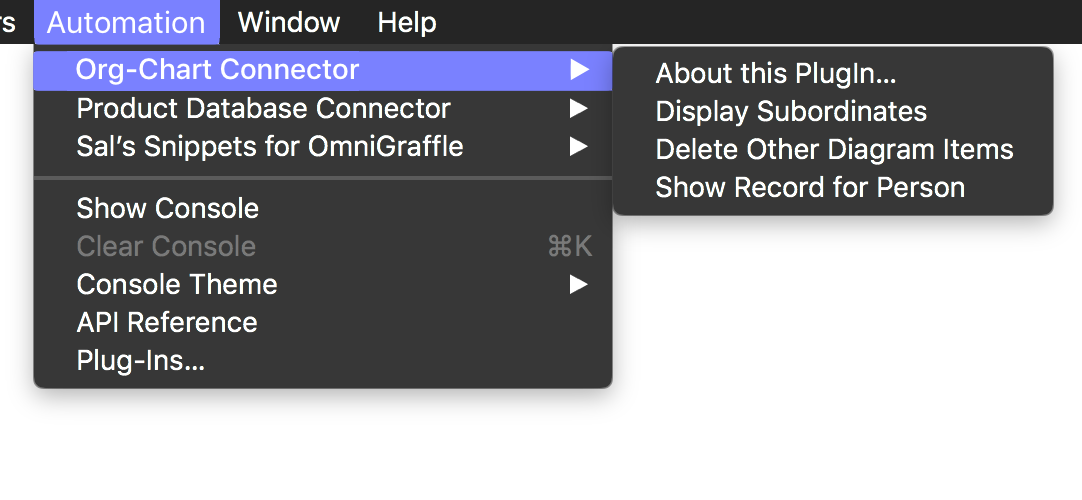
The PlugIn’s sub-menu in OmniGraffle’s Automation menu on macOS:

Descriptions of the individual plugin actions:
1 About This PlugIn… summons a dialog displaying information about the plugin, including identifier string and a link to this documentation.
2 Display Subordinates uses the metadata keys assigned to the selected graphic, with the stored database JSON to locate and identify the direct reports for the person represented by the graphic. The script then creates linked shapes for each of the reports, and assigns their Employee Name and Employee ID to the created shapes.
1 Delete Other Diagram Items is used to remove all tagged graphic except the one currently selected.
1 Show Record for Person switches to FileMaker and displays the record whose data is represented by the currently selected graphic. Note that in order to display the related record in FileMaker, this script creates and executes a fmp:// protocol link using the metdata assigned to the selected graphic. The link triggers the execution of a FileMaker script for looking up a record using an Employee ID.
The Display Subordinates Script
Here is the script for creating subordinate objects:
| Display Subordinates | ||
| 01 | /*{ | |
| 02 | "type": "action", | |
| 03 | "author": "Nyhthawk Productions", | |
| 04 | "description": "Dynamically creates hierarchic diagrams by displaying the subordinates of the selected hierarchical graphic.", | |
| 05 | "label": "Display Subordinates", | |
| 06 | "shortLabel": "Display Subordinates" | |
| 07 | }*/ | |
| 08 | ||
| 09 | var _ = function(){ | |
| 10 | ||
| 11 | var action = new PlugIn.Action(function(selection,sender){ | |
| 12 | // action code | |
| 13 | var cnvs = selection.canvas | |
| 14 | var sourceGraphic = selection.graphics[0] | |
| 15 | console.log(sourceGraphic.name) | |
| 16 | // get employee ID from user data | |
| 17 | employeeID = sourceGraphic.userData['Employee ID'] | |
| 18 | // get JSON from canvas notes | |
| 19 | var orgJSON = cnvs.background.notes | |
| 20 | reports = getReportsForID(orgJSON,employeeID) | |
| 21 | if (reports != []){ | |
| 22 | console.log('adding subordinates') | |
| 23 | reports.forEach(function(empID){ | |
| 24 | empName = getOtherKeyValueForObjWithKeyValue(orgJSON, | |
| 25 | cloneConnectRename(sourceGraphic,empName,empID) | |
| 26 | }) | |
| 27 | console.log('performing layout') | |
| 28 | document.windows[0].selection.canvas.layout() | |
| 29 | if (cnvs.automaticLayout === false){ | |
| 30 | console.log('bounds of canvas content') | |
| 31 | var g = document.windows[0].selection.canvas.graphics | |
| 32 | var gr = new Group(g) | |
| 33 | var rect = gr.geometry | |
| 34 | gr.ungroup() | |
| 35 | console.log('zoom and center') | |
| 36 | document.windows[0].selection.view.visibleRect = rect | |
| 37 | document.windows[0].centerVisiblePoint = rect.center | |
| 38 | } | |
| 39 | console.log('select source graphic') | |
| 40 | document.windows[0].selection.view.select([sourceGraphic],false) | |
| 41 | console.log(sourceGraphic.name) | |
| 42 | } | |
| 43 | }) | |
| 44 | ||
| 45 | action.validate = function(selection,sender){ | |
| 46 | // validation code | |
| 47 | if(selection.graphics.length === 1){return true} else {return false} | |
| 48 | }; | |
| 49 | ||
| 50 | return action; | |
| 51 | }(); | |
| 52 | _; | |
| 53 | ||
| 54 | function getReportsForID(data,empID){ | |
| 55 | jObj = JSON.parse(data) | |
| 56 | var reports = [] | |
| 57 | for (i = 0; i < jObj.length; i++) { | |
| 58 | jItem = jObj[i] | |
| 59 | if (jItem['Employee ID'] == empID){ | |
| 60 | reports = jItem['Reports'] | |
| 61 | break | |
| 62 | } | |
| 63 | } | |
| 64 | return reports | |
| 65 | } | |
| 66 | ||
| 67 | function getOtherKeyValueForObjWithKeyValue(data,pivotKey, | |
| 68 | jObj = JSON.parse(data) | |
| 69 | for (i = 0; i < jObj.length; i++){ | |
| 70 | jItem = jObj[i] | |
| 71 | if (jItem[pivotKey] == pivotValue){ | |
| 72 | return jItem[targetKey] | |
| 73 | } | |
| 74 | } | |
| 75 | return null | |
| 76 | } | |
| 77 | ||
| 78 | function cloneConnectRename(graphic,empName,empID){ | |
| 79 | cnvs = document.windows[0].selection.canvas | |
| 80 | graphic.allowsConnections = true | |
| 81 | geo = graphic.geometry | |
| 82 | offset = 72 | |
| 83 | clone = graphic.duplicateTo(new Point(geo.minX, geo.maxY + offset),cnvs) | |
| 84 | line = cnvs.connect(graphic,clone) | |
| 85 | line.lineType = LineType.Straight | |
| 86 | if(graphic.strokeColor == null){ | |
| 87 | lcolor = Color.black | |
| 88 | } else { | |
| 89 | lcolor = graphic.strokeColor | |
| 90 | } | |
| 91 | line.strokeColor = lcolor | |
| 92 | line.shadowColor = null | |
| 93 | line.strokeThickness = 4 | |
| 94 | line.strokeType = StrokeType.Single | |
| 95 | line.headType = 'Arrow' | |
| 96 | line.tailType = 'None' | |
| 97 | clone.setUserData('Employee ID',empID) | |
| 98 | clone.setUserData('Employee Name',empName) | |
| 99 | clone.name = empName + ' ' + empID | |
| 100 | clone.text = empName + '\n' + empID | |
| 101 | cnvs.layout() | |
| 102 | } | |
1-52 The main action code. Note that this version includes a metadata header 1-7 to enable it to be used as a stand-alone solitary action if desired.
67-76 A supporting function for looking up a record based upon the contents of its unique identifier field. In other words, you could derive the employee’s name by using the employee’s ID.
78-102 The routine for creating a new diagram object linked from the selected graphic.
Creating an Org-Chart
| DO THIS ► | DOWNLOAD the Org-Chart OmniGraffle template file. Open in OmniGraffle to install. |
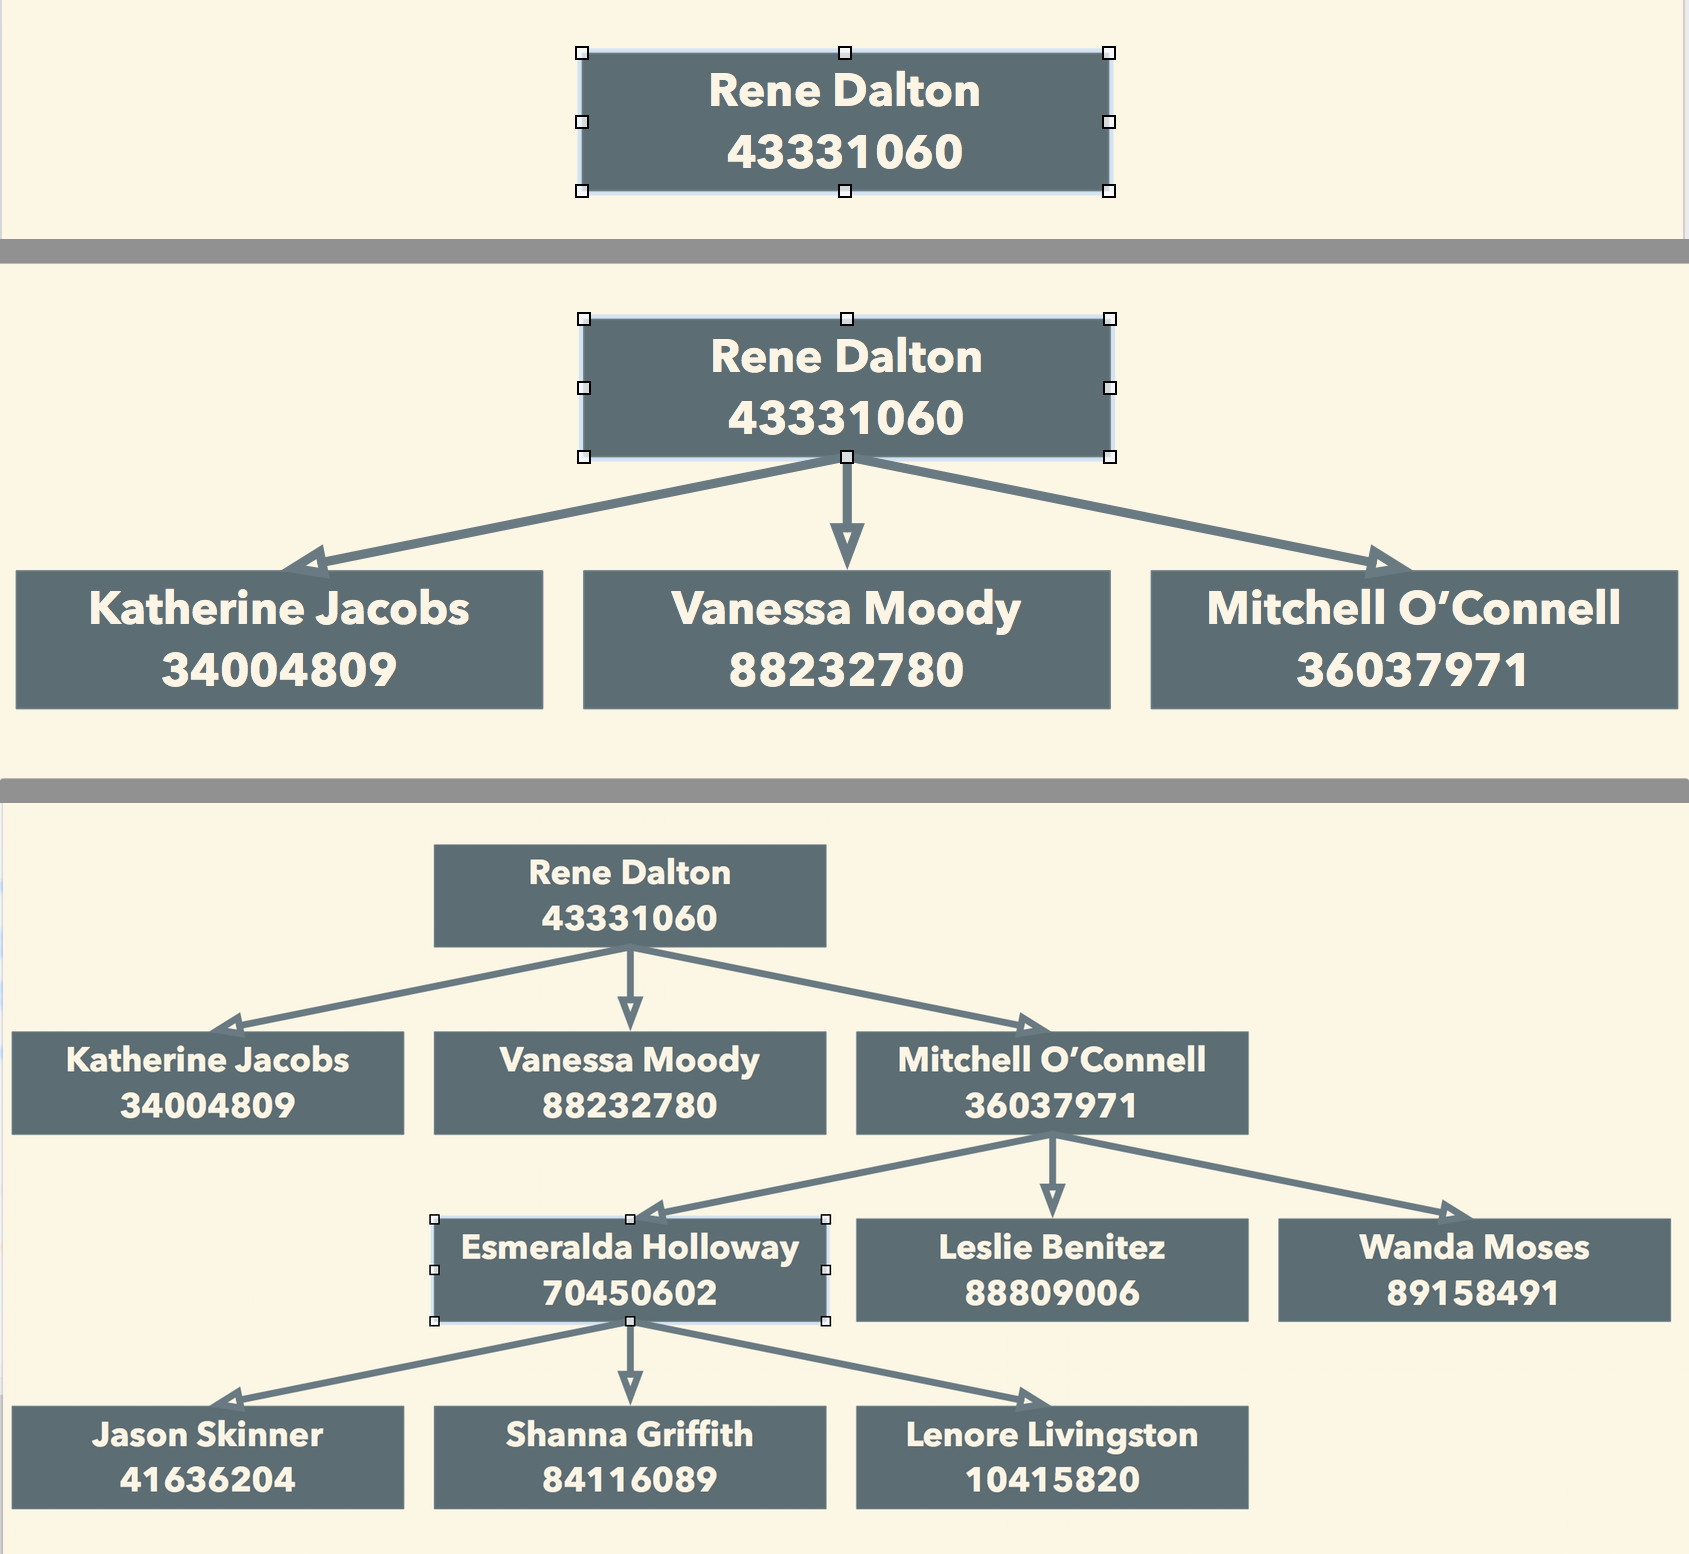
To create an organization chart, create a new document using the downloaded template. The new document will contain a single graphic. Simply select the top-level graphic and run the “Show Subordinates” script. A new row of graphics will be created.
Next, select one the subordinates and run the script again. A row of graphics representing the subordinates will be created.
Fill in the chart as desired, by selecting solitary graphics and running the script. If there are no subordinates of the represented employee, none will be created.

To start over, select the top-level graphic and run the “Delete Other Diagram Items” script.
Next
In the next section, we’ll examine how to display the source FileMaker for a selected graphic.
This webpage is in the process of being developed. Any content may change and may not be accurate or complete at this time.
DISCLAIMER
