Plug-In: Append Generated Chart Image 
This plug-in uses the tabbed data copied to the clipboard, along with the QuickChart.io online charting service, to generate a basic bar chart image, and append it as an inline text attachment to the note of the selected project or task.
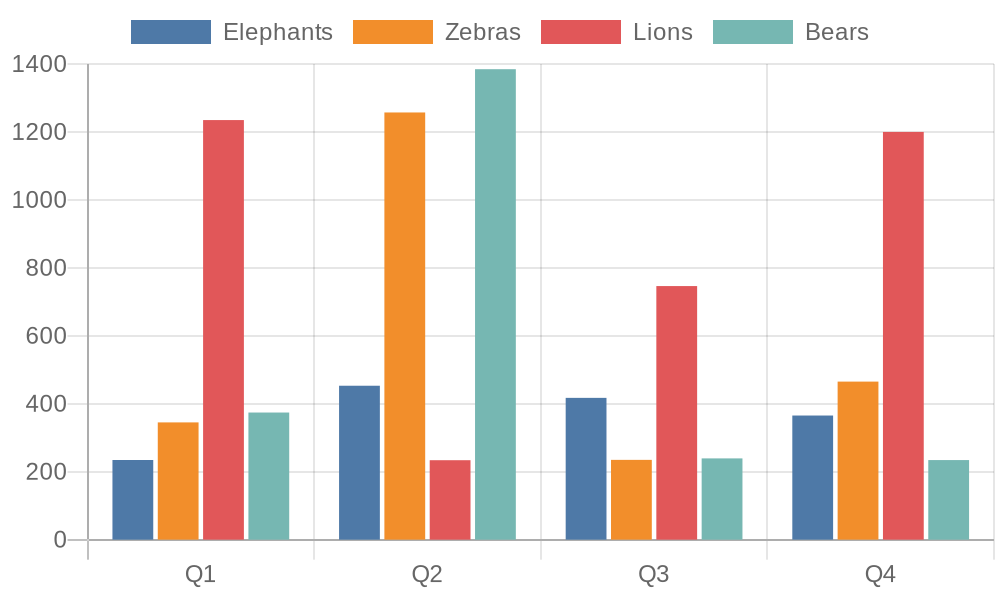
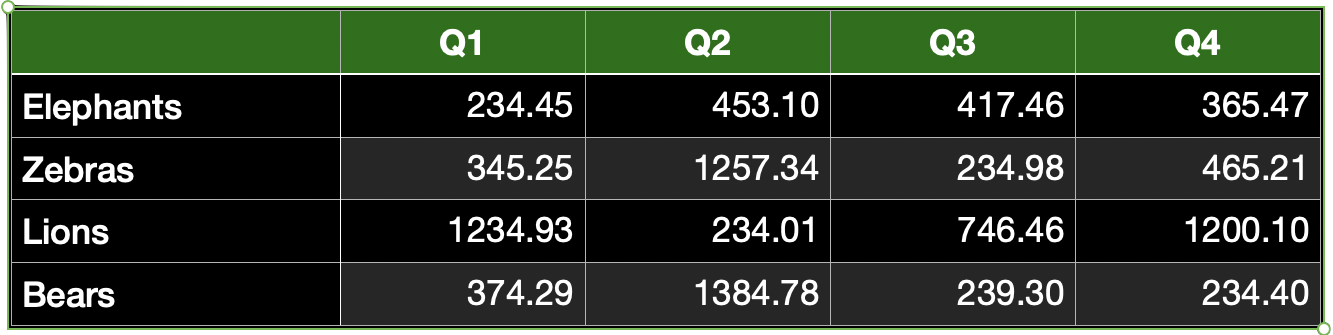
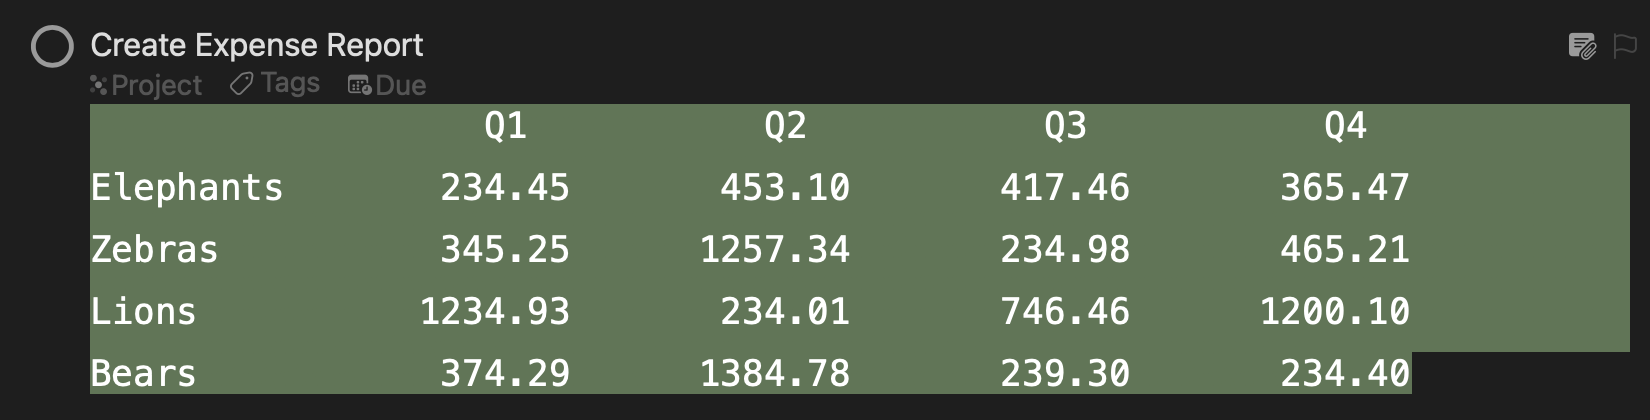
IMPORTANT: It is expected that the copied tabbed data include BOTH row and column headers. Here are illustrations of acceptable tabbed data selected in Numbers (top) or in an OmniFocus note (below):
Once the chart image has been generated by the online service, it will be appended to the end of the note of the selected OmniFocus project or task, as an inline text attachment.
Return to: OmniFocus Plug-In Collection
Append Generated Chart Image
/*{"type": "action","targets": ["omnifocus"],"author": "Otto Automator","identifier": "com.omni-automation-of.append-generated-chart-image","version": "1.0","description": "Uses the data on the clipboard with the QuickChart.io website to generate a chart image and append it to the note of the selected project or task.","label": "Append Generated Chart","shortLabel": "Append Chart","paletteLabel": "Append Chart","image": "chart.bar.xaxis.ascending"}*/(() => {function checkLengths(rowData){x = rowData[0].lengthfor (i = 1; i < rowData.length; i++) {if(rowData[i].length !== x){return false}}return true}const action = new PlugIn.Action(async function(selection, sender){try {// PROMPT USERalertTitle = "Append Bar Chart"alertMessage = "Using the online QuickChart service, plug-in will create and insert a basic bar chart using the spreadsheet currently on the clipboard."alert = new Alert(alertTitle, alertMessage)alert.addOption("Continue")alert.addOption("Visit QuickChart")buttonIndex = await alert.show()if (buttonIndex !== 0){URL.fromString("https://quickchart.io").open()return "Cancel Operation"}// RETRIEVE CLIPBOARD TEXTclipboardStr = Pasteboard.general.stringconsole.log("clipboardStr:\n", clipboardStr)// DIVIDE INTO ARRAYS OF ROW DATAclipboardData = clipboardStr.split('\n').map(line => line.split('\t'))console.log("clipboardData:\n", JSON.stringify(clipboardData))// CHECK LENGTH OF EVERY ROWcheckResult = checkLengths(clipboardData)if(!checkResult){throw {name: "Data Integrity Issue",message: "Not all rows have the same number of columns."}}// FIRST ARRAY(ROW) IS COLUMN HEADERScolumnHeaders = clipboardData.shift()// REMOVE 1st COLUMN HEADERcolumnHeaders.shift()console.log("columnHeaders:", columnHeaders)datasetsArray = new Array()for (indx in clipboardData){aDataObj = clipboardData[indx]// ["Elephants","234.45","453.10","417.46","365.47"]aDataObjLabel = aDataObj.shift()aDatasetObj = new Object()aDatasetObj["label"] = aDataObjLabelaDatasetObj["data"] = aDataObj// {"label":"ROW A","data":[100, 200, 300, 400]}console.log("aDatasetObj", JSON.stringify(aDatasetObj))datasetsArray.push(aDatasetObj)}// THE CHART DATA OBJECTdataObj = new Object()dataObj["labels"] = columnHeadersdataObj["datasets"] = datasetsArraychartItemsObj = new Object()chartItemsObj["type"] = "bar"chartItemsObj["data"] = dataObjconsole.log("chartItemsObj", JSON.stringify(chartItemsObj))// RESULTING CHART DATA OBJECT/*{"type":"bar","data":{"labels":["Q1","Q2","Q3","Q4"],"datasets":[{"label":"ROW A","data":[100,200,300,400]},{"label":"ROW B","data":[100,200,300,400]},…]}}*/// THE CHART OBJECTchartObj = new Object()chartObj["backgroundColor"] = "transparent"chartObj["format"] = "png"chartObj["chart"] = chartItemsObj// RESULTING CHART OBJECT/*{"backgroundColor":"transparent","format":"png","chart":{"type":"bar","data":{"labels":["Q1","Q2","Q3","Q4"],"datasets":[{"label":"ROW A","data":[100,200,300,400]},{"label":"ROW B","data":[100,200,300,400]},…]}}}*/// SELECTED PROJECT OR TASKitem = selection.databaseObjects[0]noteObj = item.noteTextnStyle = noteObj.style// CONSTRUCT FETCH REQUESTtargetURLString = "https://quickchart.io/chart"request = URL.FetchRequest.fromString(targetURLString)request.headers = {"Content-Type":"application/json"}request.method = 'POST'request.bodyString = JSON.stringify(chartObj)// SEND REQUEST AND WAIT FOR RESULTresponse = await request.fetch()responseCode = response.statusCodeif (responseCode >= 200 && responseCode < 300){// INSERT IMAGE AS INLINE TEXT ATTACHMENT OBJECTwrapper = FileWrapper.withContents("ex-chart.png", response.bodyData)attachmentObj = Text.makeFileAttachment(wrapper, noteObj.style)if(noteObj.range.isEmpty){noteObj.insert(noteObj.start, attachmentObj)} else {newLineObj = new Text('\n', noteObj.style)noteObj.append(newLineObj, noteObj.style)noteObj.append(attachmentObj, noteObj.style)}node = document.windows[0].content.selectedNodes[0]node.expandNote(false)} else {throw {name: "Server Response Code",message: `The server responded with code: ${responseCode}`}}}catch(err){if(!err.causedByUserCancelling){console.error(err.name, err.message)new Alert(err.name, err.message).show()}}});action.validate = function(selection, sender){singleItemIsSelected = (selection.databaseObjects.length === 1 &&selection.projects.length === 1 ||selection.tasks.length === 1)return (Pasteboard.general.hasStrings && singleItemIsSelected)};return action;})();