Subgraphs
A Subgraph is a type of ‘Group’ that can be expanded and collapsed to show or hide its contents.
cnvs = document.windows[0].selection.canvas
subgraphs = new Array()
cnvs.graphics.forEach(function(graphic){
if(graphic instanceof Subgraph){subgraphs.push(graphic)}
})
Get All Subgraphs on Current Canvas Copy Script 01 cnvs = document .windows [0].selection .canvas 02 subgraphs = new Array ()03 cnvs .graphics .forEach (function (graphic ){04 if (graphic instanceof Subgraph ){subgraphs .push (graphic )}05 })
var subgraphs = new Array()
canvases.forEach(function(cnvs){
cnvs.graphics.forEach(function(graphic){
if(graphic instanceof Subgraph){subgraphs.push(graphic)}
})
})
Get All Subgraphs in Document Copy Script 01 var subgraphs = new Array ()02 canvases .forEach (function (cnvs ){03 cnvs .graphics .forEach (function (graphic ){04 if (graphic instanceof Subgraph ){subgraphs .push (graphic )}05 })06 })
Creating a Subgraph from Selected Graphics
Here’s a simple example script demonstrating how to create a new subgraph using the selected graphics:
var grphx = document.windows[0].selection.graphics
var sg = new Subgraph(grphx)
omnigraffle://localhost/omnijs-run?script=var%20grphx%20%3D%20document%2Ewindows%5B0%5D%2Eselection%2Egraphics%0Avar%20sg%20%3D%20new%20Subgraph%28grphx%29
New Subgraph from Selected Graphics Copy Script Run Script 01 var grphx = document .windows [0].selection .graphics 02 var sg = new Subgraph (grphx )
Instance Properties
Here are the properties of the Subgraph class:
background (Solid ) • The background graphic which is shown behind the contents when expanded, and by itself when collapsed. The label of the subgraph is the text of its background shape.
collapsed (boolean) • Whether this subgraph is currently collapsed.
subgraphics (Array of Graphics ) • An array of graphics contained inside the subgraph.
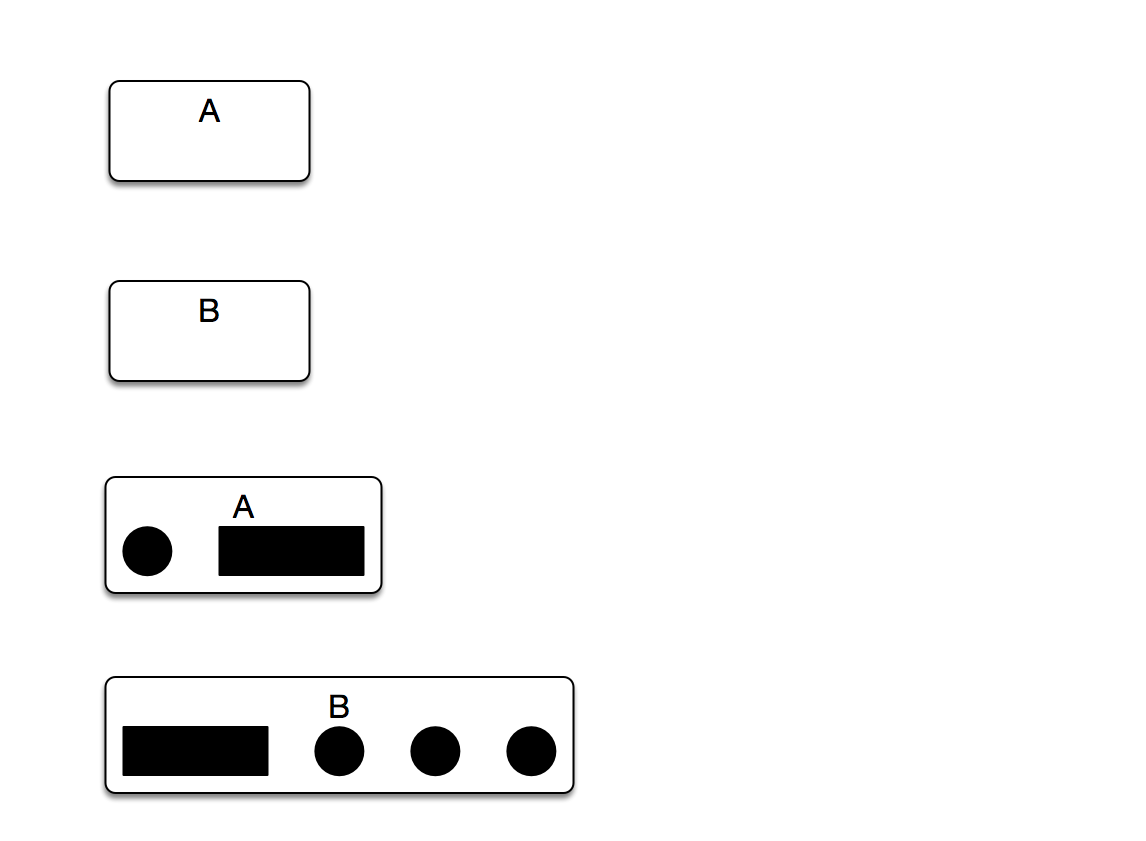
Here is an example script that creates new subgraphs containing newly created graphics. The example shows letters using International Morse Code .
var canvas = document.windows[0].selection.canvas;
var g1 = canvas.newShape();
g1.shape = "Circle";
g1.fillColor = Color.black;
g1.geometry = new Rect(100, 100, 24.00, 24.00);
g1.shadowColor = null;
var g2 = canvas.newShape();
g2.shape = "Rectangle";
g2.fillColor = Color.black;
g2.geometry = new Rect(148, 100, 72.00, 24.00);
g2.shadowColor = null;
subgraph = new Subgraph([g1,g2]);
subgraph.background.text = "A";
subgraph.collapsed = true;
var g3 = canvas.newShape();
g3.shape = "Rectangle";
g3.fillColor = Color.black;
g3.geometry = new Rect(100, 200, 72.00, 24.00);
g3.shadowColor = null;
var g4 = canvas.newShape();
g4.shape = "Circle";
g4.fillColor = Color.black;
g4.geometry = new Rect(196, 200, 24.00, 24.00);
g4.shadowColor = null;
var g5 = canvas.newShape();
g5.shape = "Circle";
g5.fillColor = Color.black;
g5.geometry = new Rect(244, 200, 24.00, 24.00);
g5.shadowColor = null;
var g6 = canvas.newShape();
g6.shape = "Circle";
g6.fillColor = Color.black;
g6.geometry = new Rect(292, 200, 24.00, 24.00);
g6.shadowColor = null;
subgraph = new Subgraph([g3,g4,g5,g6]);
subgraph.background.text = "B";
subgraph.collapsed = true;
omnigraffle://localhost/omnijs-run?script=var%20canvas%20%3D%20document%2Ewindows%5B0%5D%2Eselection%2Ecanvas%3B%0A%0Avar%20g1%20%3D%20canvas%2EnewShape%28%29%3B%0Ag1%2Eshape%20%3D%20%22Circle%22%3B%0Ag1%2EfillColor%20%3D%20Color%2Eblack%3B%0Ag1%2Egeometry%20%3D%20new%20Rect%28100%2C%20100%2C%2024%2E00%2C%2024%2E00%29%3B%0Ag1%2EshadowColor%20%3D%20null%3B%0A%0Avar%20g2%20%3D%20canvas%2EnewShape%28%29%3B%0Ag2%2Eshape%20%3D%20%22Rectangle%22%3B%0Ag2%2EfillColor%20%3D%20Color%2Eblack%3B%0Ag2%2Egeometry%20%3D%20new%20Rect%28148%2C%20100%2C%2072%2E00%2C%2024%2E00%29%3B%0Ag2%2EshadowColor%20%3D%20null%3B%0A%0Asubgraph%20%3D%20new%20Subgraph%28%5Bg1%2Cg2%5D%29%3B%0Asubgraph%2Ebackground%2Etext%20%3D%20%22A%22%3B%0Asubgraph%2Ecollapsed%20%3D%20true%3B%0A%0Avar%20g3%20%3D%20canvas%2EnewShape%28%29%3B%0Ag3%2Eshape%20%3D%20%22Rectangle%22%3B%0Ag3%2EfillColor%20%3D%20Color%2Eblack%3B%0Ag3%2Egeometry%20%3D%20new%20Rect%28100%2C%20200%2C%2072%2E00%2C%2024%2E00%29%3B%0Ag3%2EshadowColor%20%3D%20null%3B%0A%0Avar%20g4%20%3D%20canvas%2EnewShape%28%29%3B%0Ag4%2Eshape%20%3D%20%22Circle%22%3B%0Ag4%2EfillColor%20%3D%20Color%2Eblack%3B%0Ag4%2Egeometry%20%3D%20new%20Rect%28196%2C%20200%2C%2024%2E00%2C%2024%2E00%29%3B%0Ag4%2EshadowColor%20%3D%20null%3B%0A%0Avar%20g5%20%3D%20canvas%2EnewShape%28%29%3B%0Ag5%2Eshape%20%3D%20%22Circle%22%3B%0Ag5%2EfillColor%20%3D%20Color%2Eblack%3B%0Ag5%2Egeometry%20%3D%20new%20Rect%28244%2C%20200%2C%2024%2E00%2C%2024%2E00%29%3B%0Ag5%2EshadowColor%20%3D%20null%3B%0A%0Avar%20g6%20%3D%20canvas%2EnewShape%28%29%3B%0Ag6%2Eshape%20%3D%20%22Circle%22%3B%0Ag6%2EfillColor%20%3D%20Color%2Eblack%3B%0Ag6%2Egeometry%20%3D%20new%20Rect%28292%2C%20200%2C%2024%2E00%2C%2024%2E00%29%3B%0Ag6%2EshadowColor%20%3D%20null%3B%0A%0Asubgraph%20%3D%20new%20Subgraph%28%5Bg3%2Cg4%2Cg5%2Cg6%5D%29%3B%0Asubgraph%2Ebackground%2Etext%20%3D%20%22B%22%3B%0Asubgraph%2Ecollapsed%20%3D%20true%3B
Create New Subgraphs Copy Script Run Script 01 var canvas = document .windows [0].selection .canvas ;02 03 var g1 = canvas .newShape ();04 g1 .shape = "Circle" ;05 g1 .fillColor = Color .black ;06 g1 .geometry = new Rect (100, 100, 24.00, 24.00);07 g1 .shadowColor = null ;08 09 var g2 = canvas .newShape ();10 g2 .shape = "Rectangle" ;11 g2 .fillColor = Color .black ;12 g2 .geometry = new Rect (148, 100, 72.00, 24.00);13 g2 .shadowColor = null ;14 15 subgraph = new Subgraph ([g1 ,g2 ]);16 subgraph .background .text = "A" ;17 subgraph .collapsed = true ;18 19 var g3 = canvas .newShape ();20 g3 .shape = "Rectangle" ;21 g3 .fillColor = Color .black ;22 g3 .geometry = new Rect (100, 200, 72.00, 24.00);23 g3 .shadowColor = null ;24 25 var g4 = canvas .newShape ();26 g4 .shape = "Circle" ;27 g4 .fillColor = Color .black ;28 g4 .geometry = new Rect (196, 200, 24.00, 24.00);29 g4 .shadowColor = null ;30 31 var g5 = canvas .newShape ();32 g5 .shape = "Circle" ;33 g5 .fillColor = Color .black ;34 g5 .geometry = new Rect (244, 200, 24.00, 24.00);35 g5 .shadowColor = null ;36 37 var g6 = canvas .newShape ();38 g6 .shape = "Circle" ;39 g6 .fillColor = Color .black ;40 g6 .geometry = new Rect (292, 200, 24.00, 24.00);41 g6 .shadowColor = null ;42 43 subgraph = new Subgraph ([g3 ,g4 ,g5 ,g6 ]);44 subgraph .background .text = "B" ;45 subgraph .collapsed = true ;
And here’s a script for expanding all subgraphs in the current canvas:
cnvs = document.windows[0].selection.canvas
cnvs.graphics.forEach(function(graphic){
if(graphic instanceof Subgraph){graphic.collapsed = false}
})
omnigraffle://localhost/omnijs-run?script=cnvs%20%3D%20document%2Ewindows%5B0%5D%2Eselection%2Ecanvas%0Acnvs%2Egraphics%2EforEach%28function%28graphic%29%7B%0A%09if%28graphic%20instanceof%20Subgraph%29%7Bgraphic%2Ecollapsed%20%3D%20false%7D%0A%7D%29
Expand All Subgraphs on Current Canvas Copy Script Run Script 01 cnvs = document .windows [0].selection .canvas 02 cnvs .graphics .forEach (function (graphic ){03 if (graphic instanceof Subgraph ){graphic .collapsed = false }04 })
And here’s a script for collapsing all subgraphs in the current canvas:
cnvs = document.windows[0].selection.canvas
cnvs.graphics.forEach(function(graphic){
if(graphic instanceof Subgraph){graphic.collapsed = true}
})
omnigraffle://localhost/omnijs-run?script=cnvs%20%3D%20document%2Ewindows%5B0%5D%2Eselection%2Ecanvas%0Acnvs%2Egraphics%2EforEach%28function%28graphic%29%7B%0A%09if%28graphic%20instanceof%20Subgraph%29%7Bgraphic%2Ecollapsed%20%3D%20true%7D%0A%7D%29
Collapse All Subgraphs on Current Canvas Copy Script Run Script 01 cnvs = document .windows [0].selection .canvas 02 cnvs .graphics .forEach (function (graphic ){03 if (graphic instanceof Subgraph ){graphic .collapsed = true }04 })
TOPICS
Overview
(API)
Stencil
Document
Canvas
Layer
Graphic
Properties
Shapes
Lines
Groups
Subgraph
Connections
Tables
Metadata
Image
Text
App-to-App
Action Template
UNDER CONSTRUCTION
This webpage is in the process of being developed. Any content may change and may not be accurate or complete at this time.
DISCLAIMER
Mention of third-party websites and products is for informational purposes only and constitutes neither an endorsement nor a recommendation. OMNI-AUTOMATION.COM assumes no responsibility with regard to the selection, performance or use of information or products found at third-party websites. OMNI-AUTOMATION.COM provides this only as a convenience to our users. OMNI-AUTOMATION.COM has not tested the information found on these sites and makes no representations regarding its accuracy or reliability. There are risks inherent in the use of any information or products found on the Internet, and OMNI-AUTOMATION.COM assumes no responsibility in this regard. Please understand that a third-party site is independent from OMNI-AUTOMATION.COM and that OMNI-AUTOMATION.COM has no control over the content on that website. Please contact the vendor for additional information.